- Go 95.2%
- Dockerfile 2.1%
- Makefile 1.4%
- Awk 1.3%
|
|
||
|---|---|---|
| .github | ||
| cmd/monero-exporter | ||
| examples | ||
| hack | ||
| pkg | ||
| tools | ||
| .gitignore | ||
| .golangci.yaml | ||
| .goreleaser.yml | ||
| .images.lock.yaml | ||
| .images.yaml | ||
| Dockerfile | ||
| go.mod | ||
| go.sum | ||
| INSTALL.md | ||
| LICENSE | ||
| Makefile | ||
| README.md | ||
| RELEASING.md | ||
monero-exporter
prometheus exporter for monero nodes.
About
monero-exporter is a single multiplatform binary that extracts metrics out of
a running monero node, allowing one to better observe the state of its own
daemon and the network as seen by it.
$ monero-exporter --help

Prometheus exporter for monero metrics

Usage:
  monero-exporter [flags]

Available Commands:
  completion  generate the autocompletion script for the specified shell
  help        Help about any command
  version     print the version of this CLI

Flags:
      --bind-addr string        address to bind the prometheus server to
                                (default ":9090")
      --geoip-filepath string   filepath of a geoip database file for ip to
                                country resolution
  -h, --help                    help for monero-exporter
      --monero-addr string      address of the monero instance to collect info
                                from (default "http://localhost:18081")
      --telemetry-path string   endpoint at which prometheus metrics are served
                                (default "/metrics")

Use "monero-exporter [command] --help" for more information about a command.
It works by issuing remote procedure calls (RPC) to a monero node and based on
the responses it gets, exposing metrics to a Prometheus server querying
monero-exporter.
  PROMETHEUS  ---- get /metrics -->---.
      ^                               |
      |                               |
      |                         MONERO-EXPORTER --- get /jsonrpc --> MONEROD
      |                               |
      |                               |
      '-------------<-- samples ------'
Typically, monero-exporter is just one piece of the stack though. A complete
setup usually looks like:
monerod, the monero daemon, is running exposing its daemon RPC for those interested in it (see monero-project/monero)monero-exportertargets thatmonerodRPC port- prometheus, configured to scrape
monero-exporter, asks it for metric samples, then stores those in its internal timeseries database - grafana then queries that timeseries data using the promql, displaying that in dashboards, alerting on thresholds, etc
  (ui)            GRAFANA
                     .
                     .
                   queries                 ..every dashboard refresh interval..
                     .
                     .
                     .
  (ts db)        PROMETHEUS --- scrape ->-.           ..every scrape interval..
                     ^                    |
                     |                    |
                     |                    |
  (exporter)         '--------------MONERO-EXPORTER
                                          .
                       ...... rpc .........                       ..on scrape..
                       .
                       .
  (daemon)          MONEROD
Installation
You can either install it by using Go, building the latest tagged release from scratch
GO111MODULE=on \
  go get github.com/cirocosta/monero-exporter/cmd/monero-exporter
or fetching the binary for your corresponding distribution from the releases page.
See INSTALL.md for details and examples.
Grafana
This repository includes a sample dashboard that makes use of the metrics exposed via this exporter (see ./grafana).
Some screenshots of it:
![]()
ps.: DO NOT publicly run the example Grafana setup without tweaking the configuration - it is way more permissive than you'd want a Grafana instance to be.
Example
Under ./examples you'll find a setup that makes use of docker-compose to bring up Prometheus, Grafana, and monero-exporter targetting an already running monero daemon (see docker-compose.yaml).
To run it, make sure you have docker and docker-compose installed. That
done, run:
# get inside the examples directory
#
cd ./examples


# brings the services (monerod, monero-exporter, grafana, and prometheus) up
# in the background
#
docker-compose up -d


# follow the logs from those services
#
docker-compose logs -f
Metrics
Below you'll find the description of the metrics exposed by monero-exporter
that are retrieved by a prometheus server, stored in its timeseries database,
and made available for querying by something like Grafana.
Keep in mind that Prometheus gather metrics in a pull-based fashion (see "Why do you pull rather than push?"), and as such, metric samples are based on information seen at the time that prometheus reached out to the exporter.
While the pull-based approach is very useful for looking at long timeframes and large number of hosts, it's not very suitable for realtime data (for that, consider other implementations for push-based systems like InfluxDB).
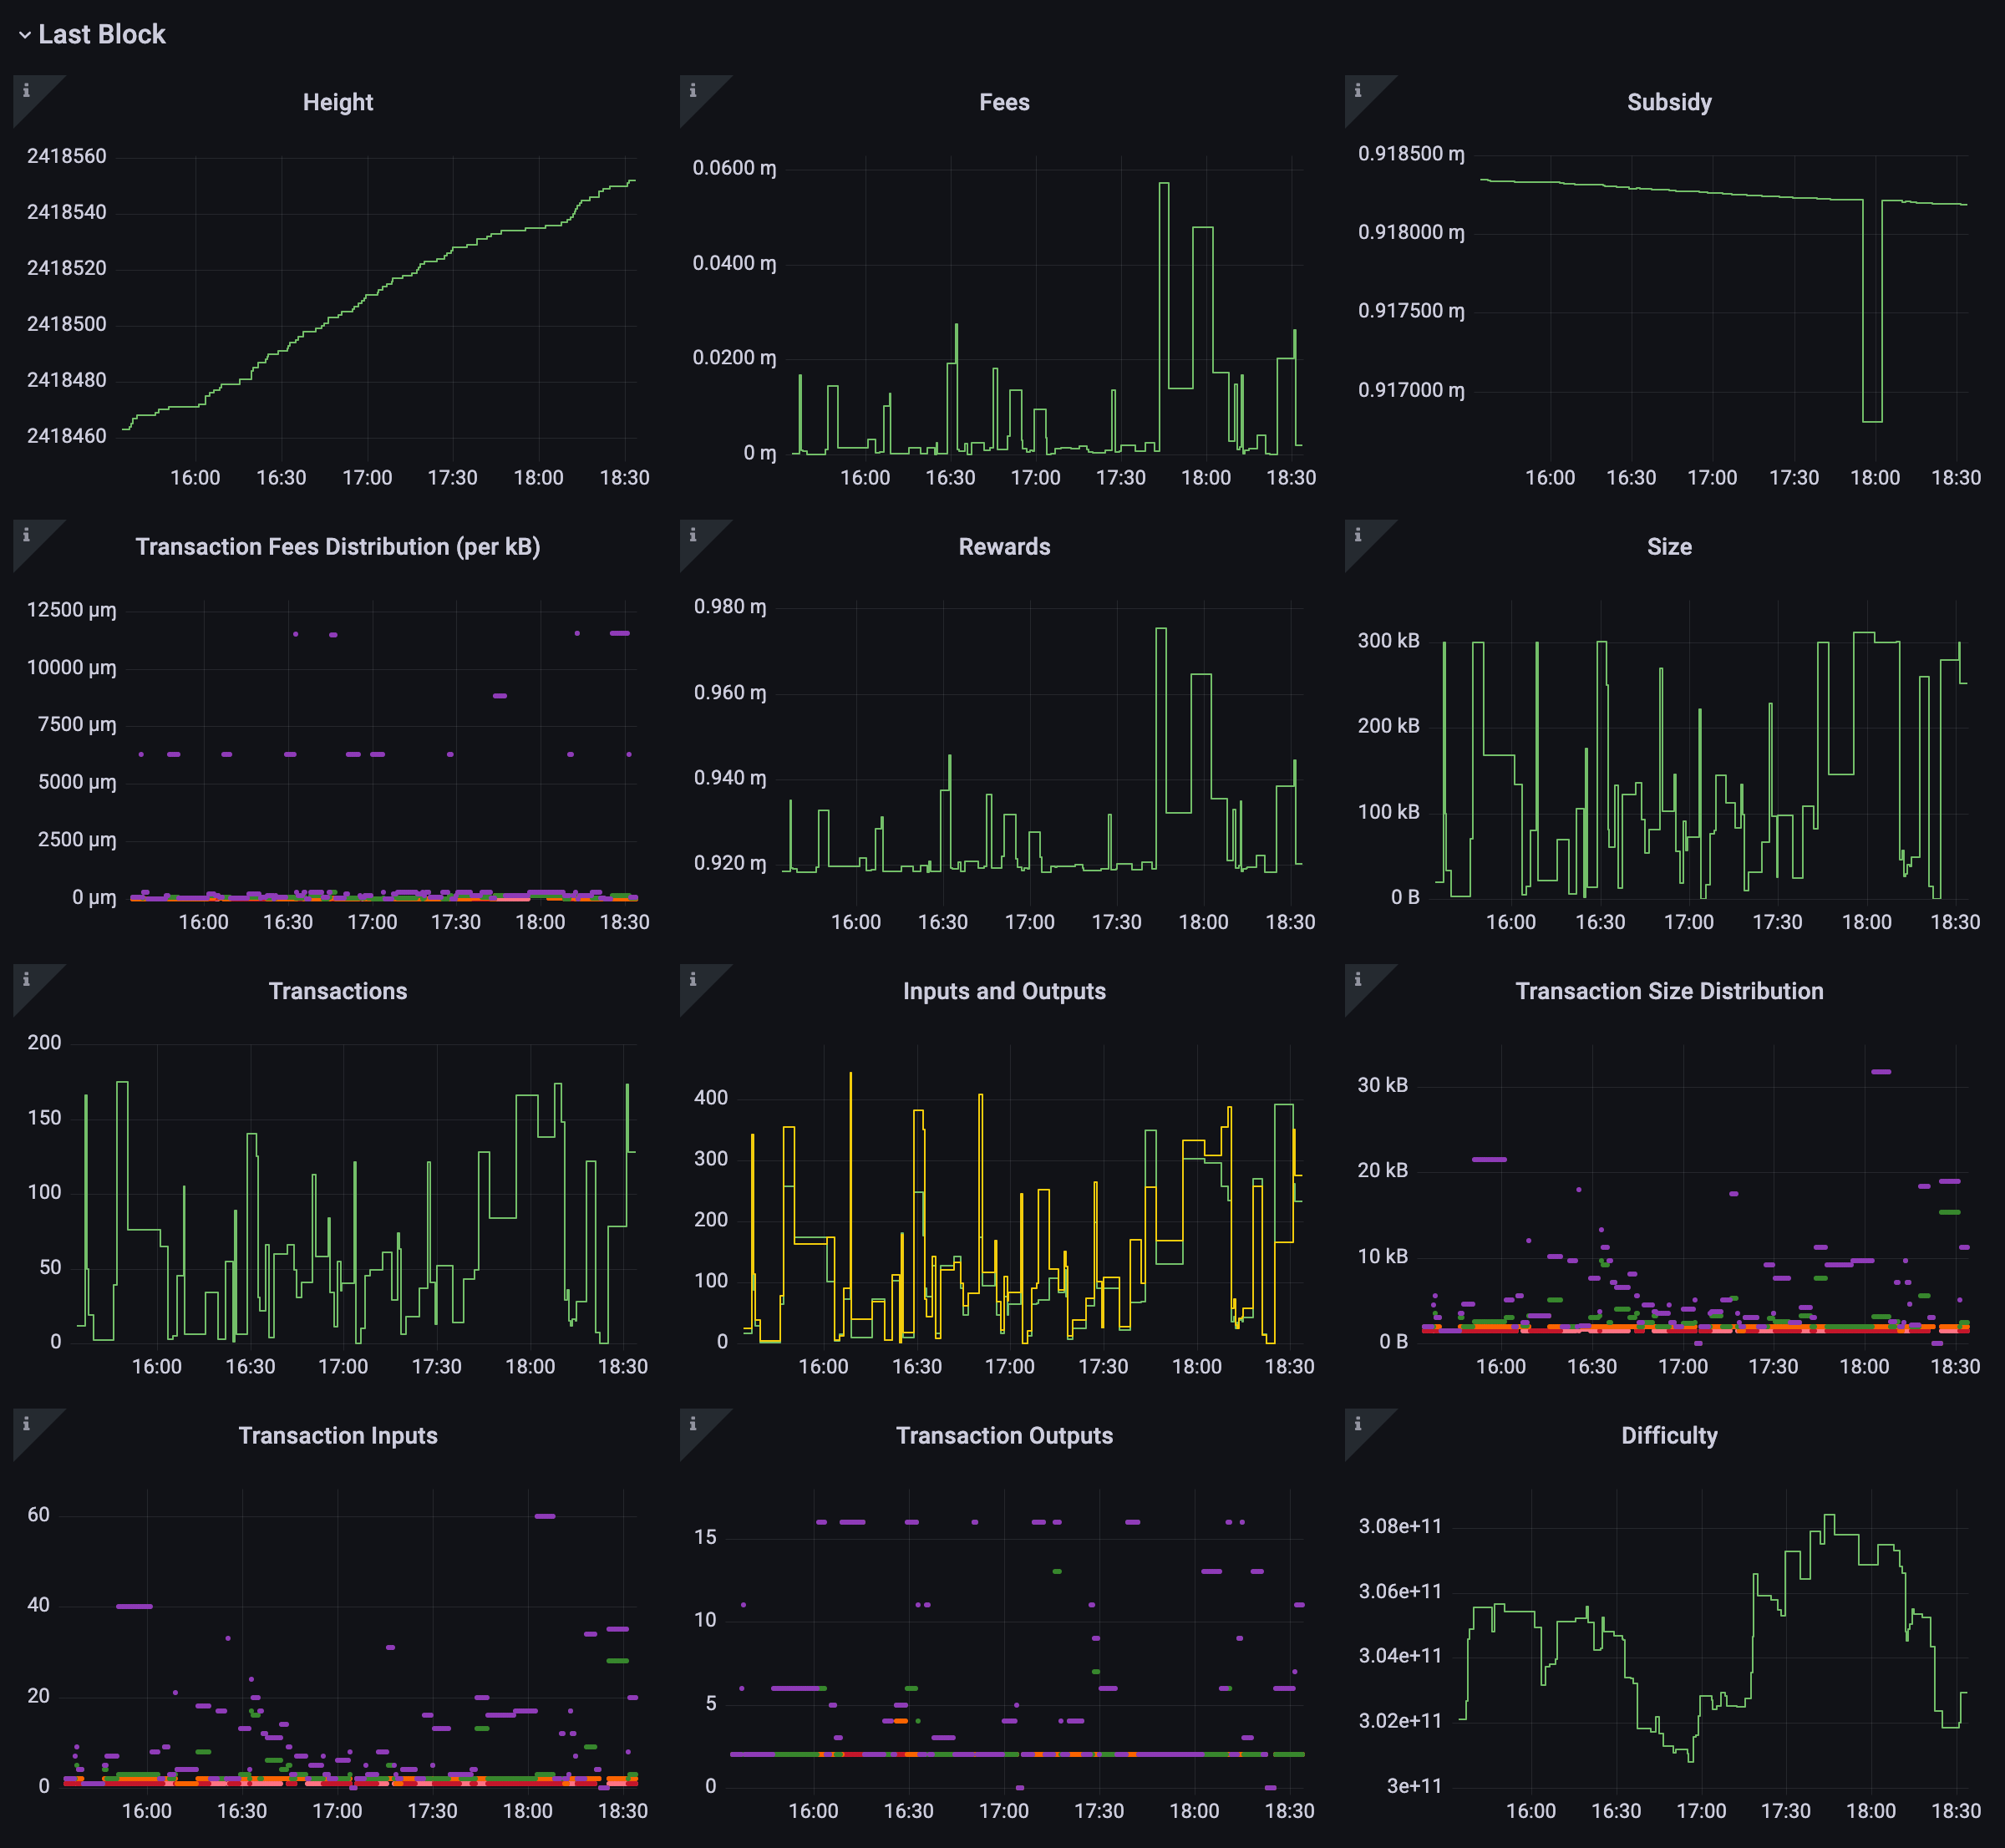
Last block
This set of metrics is extracted from information gathered regarding the last
block seen by the node at the moment that Prometheus scraped samples from
monero-exporter.
Think of it as "at time X, when I looked at the last block, these were the pieces of information I could gather from it", which when looked at over time (say, 30d), gives you a pretty good picture of what "all" (more like, most) blocks looked like as long as the interval between those scrapes where short enough (i.e., in between the mean time for a block to be mined - 2min as of today).
| name | description |
|---|---|
| monero_lastblock_difficulty | difficulty used for the last block |
| monero_lastblock_fees_micronero_per_kb | distribution of the feeperkb utilized for txns |
| monero_lastblock_fees_monero | total amount of fees included in this block |
| monero_lastblock_height | height of the last block |
| monero_lastblock_reward_monero | total amount of rewards granted in the last block (subsidy + fees) |
| monero_lastblock_size_bytes | total size of the last block |
| monero_lastblock_subsidy_monero | newly minted monero for this block |
| monero_lastblock_transactions | number of transactions seen in the last block |
| monero_lastblock_transactions_inputs | distribution of inputs in the last block |
| monero_lastblock_transactions_outputs | distribution of outputs in the last block |
| monero_lastblock_transactions_size_bytes | distribution of the size of the transactions included |
Transaction pool
These metrics give you a view of how the transaction pool of this particular node looked like when Prometheus asked the exporter information about it.
Given the pull-based nature of Prometheus, this will be only as granular as the frequency of scraping configured for it.
| name | description |
|---|---|
| monero_transaction_pool_double_spends | transactions doubly spending outputs |
| monero_transaction_pool_failing_transactions | number of transactions that are marked as failing |
| monero_transaction_pool_fees_micronero_per_kb | distribution of the feeperkb utilized for txns in the pool |
| monero_transaction_pool_fees_monero | total amount of fee being spent in the transaction pool |
| monero_transaction_pool_not_relayed | number of transactions that have not been relayed |
| monero_transaction_pool_older_than_10m | number of transactions that are older than 10m |
| monero_transaction_pool_size_bytes | total size of the transaction pool |
| monero_transaction_pool_spent_key_images | total number of key images spent across all transactions in the pool |
| monero_transaction_pool_transactions | number of transactions in the pool at the moment of the scrape |
| monero_transaction_pool_transactions_age | distribution of for how long transactions have been in the pool |
| monero_transaction_pool_transactions_inputs | distribution of inputs in the pool |
| monero_transaction_pool_transactions_outputs | distribution of outputs in the pool |
| monero_transaction_pool_transactions_size_bytes | distribution of the size of the transactions in the transaction pool |
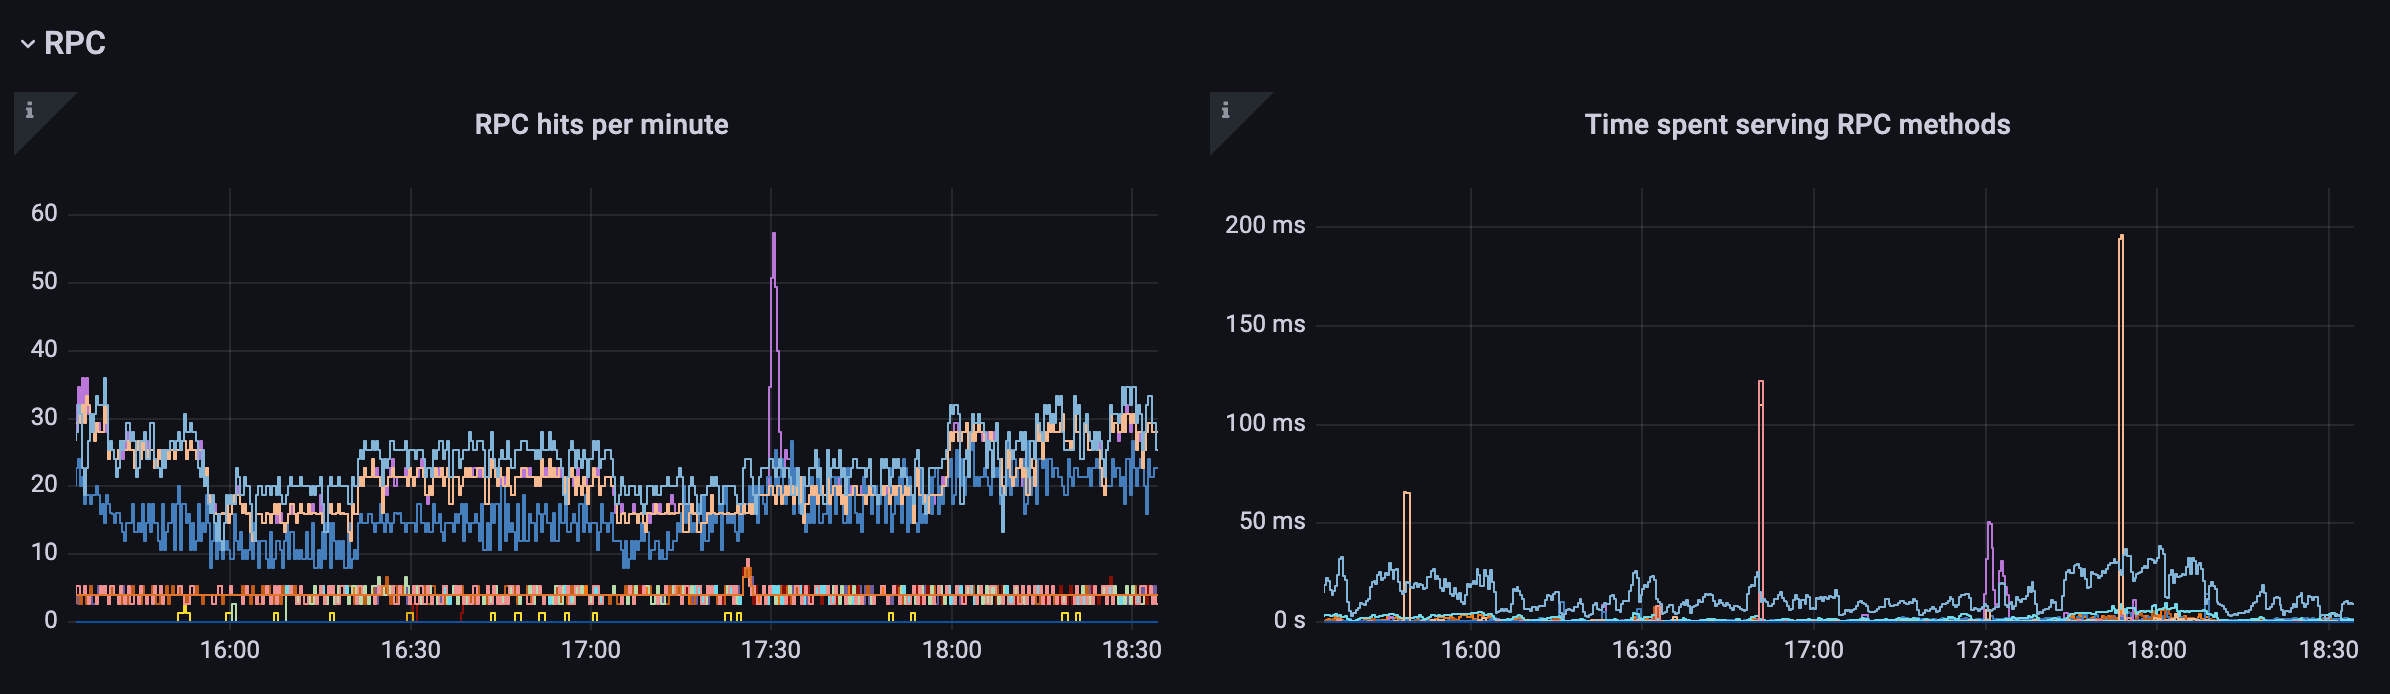
RPC
RPC metrics provide an overview of the usage of the RPC endpoints.
Note that monerod does not distinguish between monero-exporter and other
users (like, a wallet), which means that these metrics will include the
constant querying that monero-exporter performs to fetch statistics.
| name | description |
|---|---|
| monero_rpc_hits_total | number of hits that a particular rpc method had since startup |
| monero_rpc_seconds_total | amount of time spent service the method since startup |
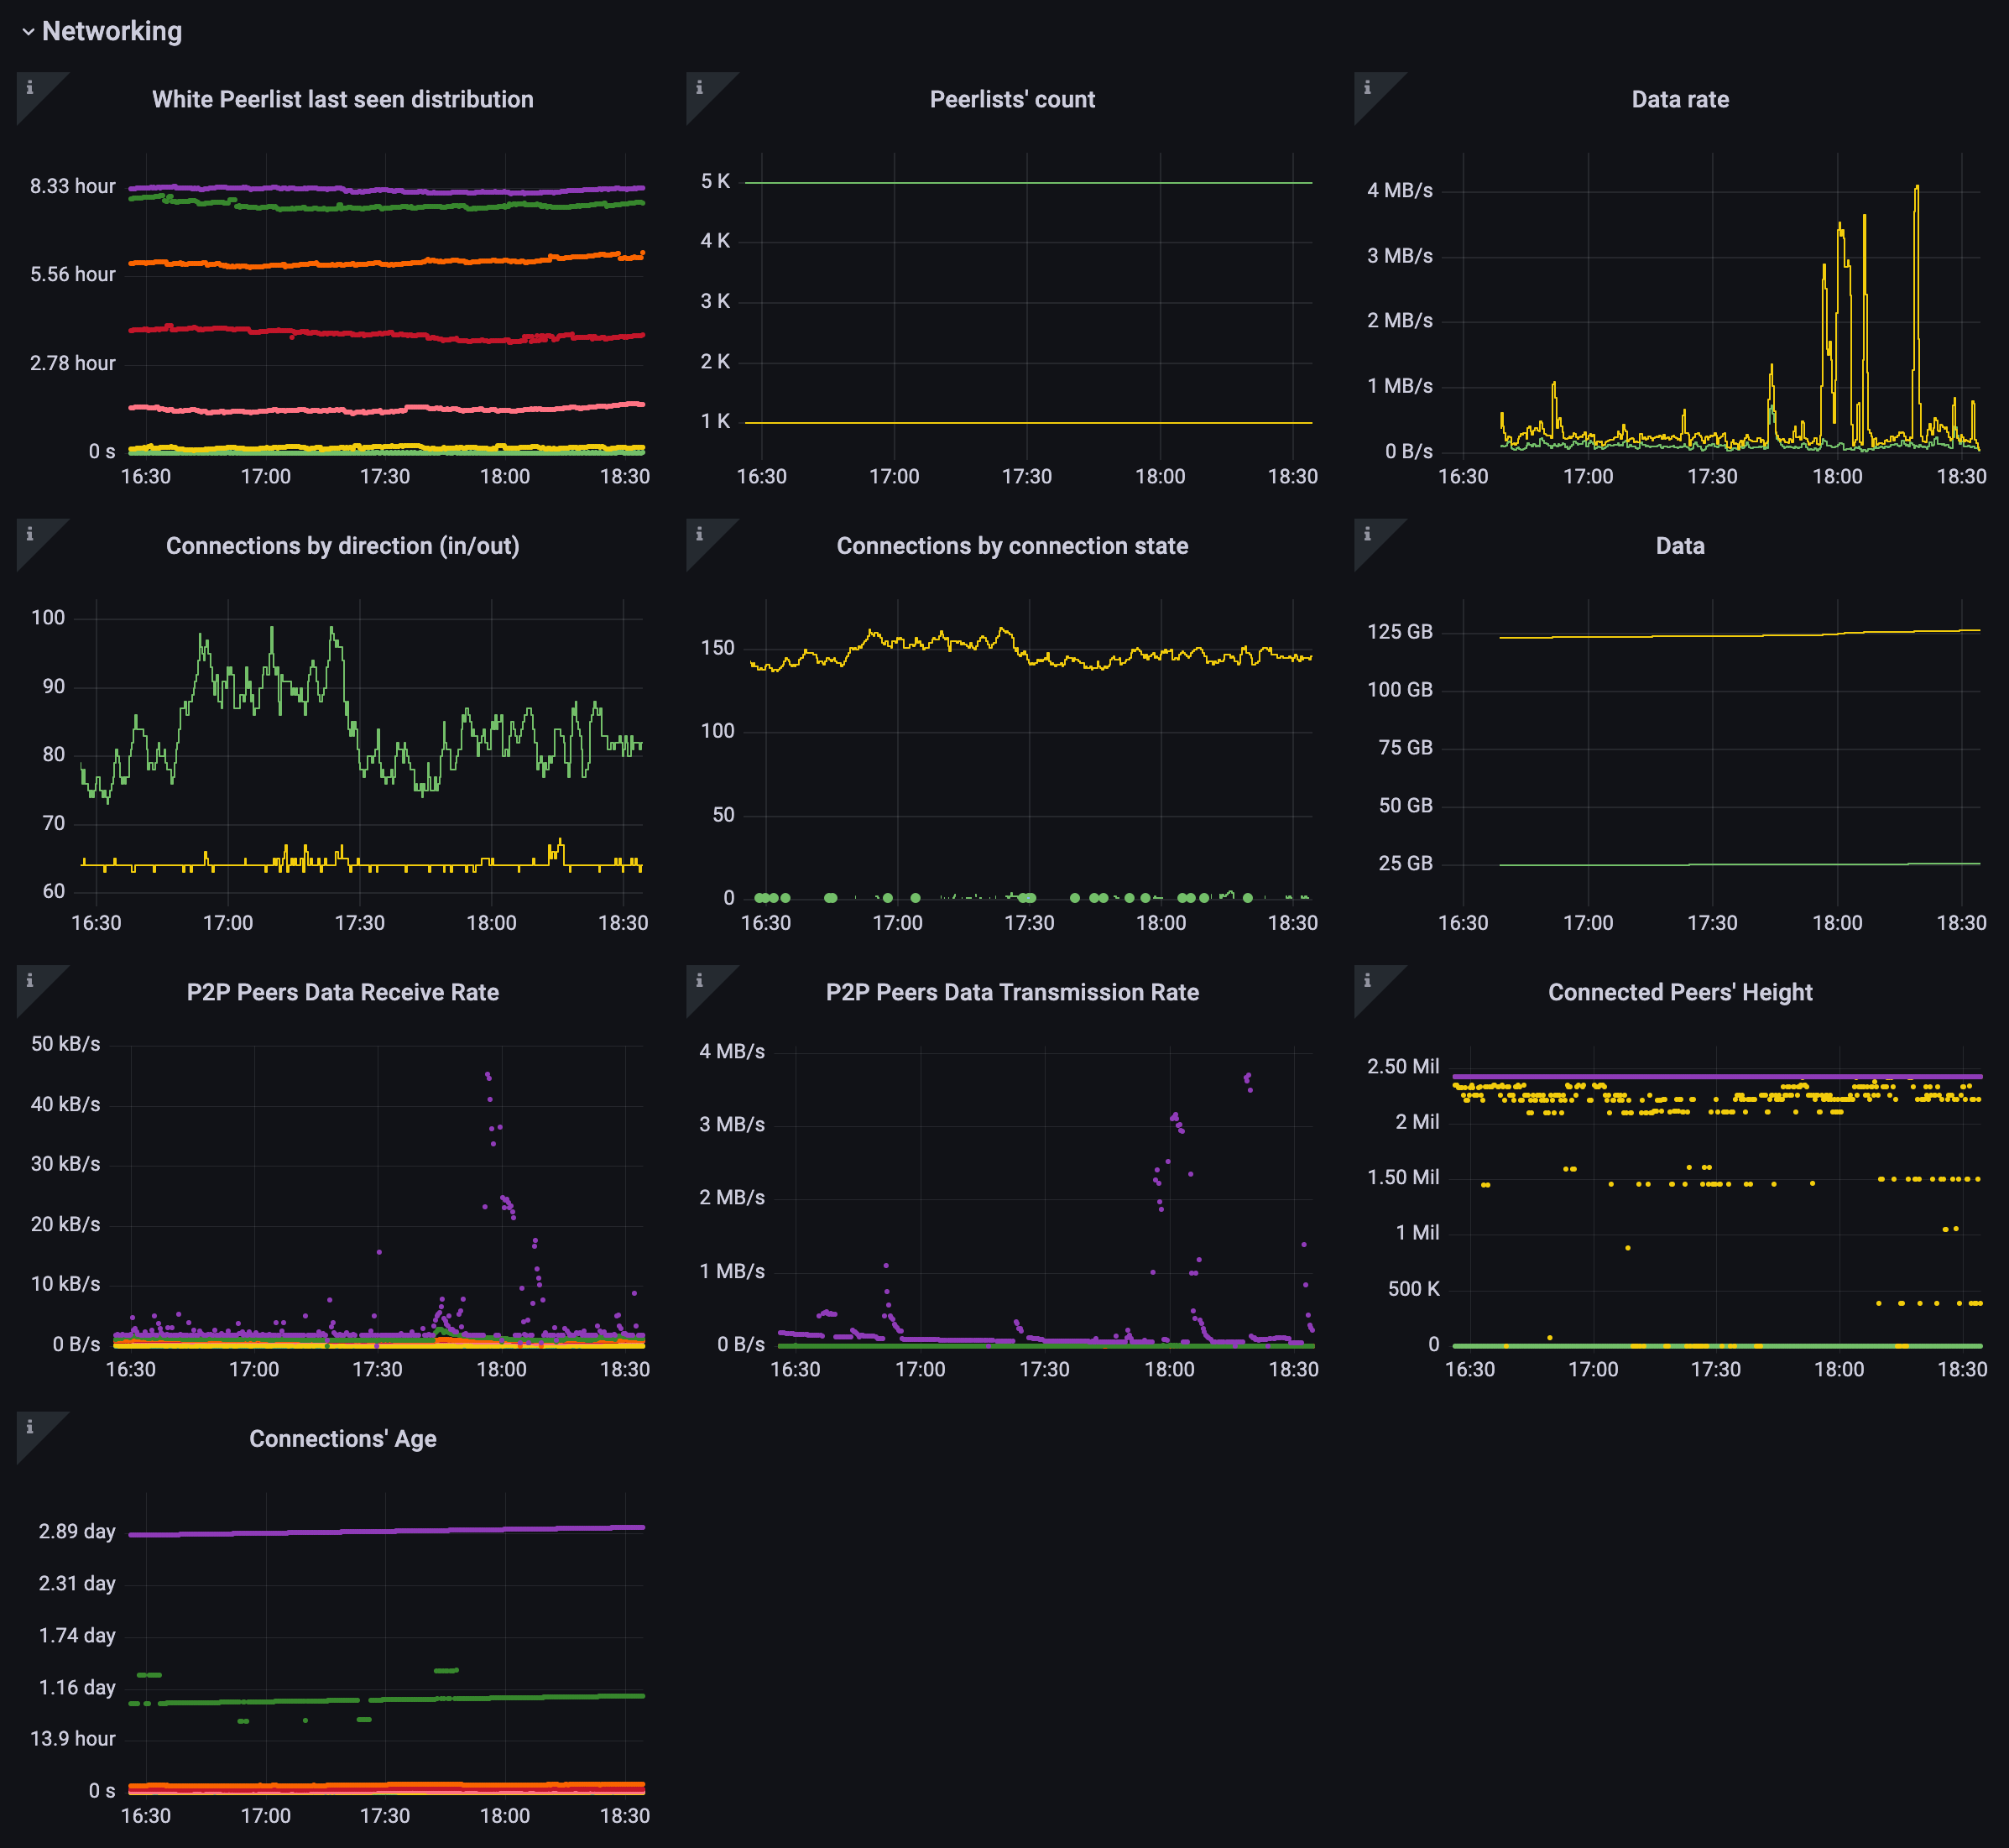
P2P Connections
Connection metrics aim at providing information about peers that are fully connected to the node (thus, transmitting and receiving data to/from our node).
| name | description |
|---|---|
| monero_p2p_connections | number of connections to/from this node |
| monero_p2p_connections_age | distribution of age of the connections we have |
| monero_p2p_connections_height | distribution the height of the peers connected to/from us |
| monero_p2p_connections_rx_rate_bps | distribution of data receive rate in bytes/s |
| monero_p2p_connections_tx_rate_bps | distribution of data transmit rate in bytes/s |
Peerlist
The monero daemon internally keeps track of potential peers to connect to called peerlists, divided in anchor, white, and gray.
| name | description |
|---|---|
| monero_peerlist | number of node entries in the peerlist |
| monero_peerlist_lastseen | distribution of when our peers have been seen |
Net Stats
Aggregated network statistics, not specific to P2P or RPC.
| name | description |
|---|---|
| monero_net_rx_bytes | number of bytes received by this node |
| monero_net_tx_bytes | number of bytes received by this node |
Info
General information about this node.
| name | description |
|---|---|
| monero_info_alternative_blocks | number of blocks alternative to the longest |
| monero_info_block_size_limit_bytes | maximum hard limit of a block |
| monero_info_block_size_median_bytes | current median size for computing dynamic fees |
| monero_info_height | current height of the chain |
| monero_info_mainnet | whether the node is connected to mainnet |
| monero_info_offline | whether the node is offline |
| monero_info_rpc_connections | number of rpc connections being served by the node |
| monero_info_synchronized | whether the node's chain is in sync with the network |
| monero_info_target_height | target height to achieve to be considered in sync |
| monero_info_uptime_seconds_total | for how long this node has been up |
| monero_info_database_size_bytes | size of the monero database |
| monero_info_free_space_bytes | amount of free space in the partition where monero's database is in |
License
See LICENSE.
Donate

891B5keCnwXN14hA9FoAzGFtaWmcuLjTDT5aRTp65juBLkbNpEhLNfgcBn6aWdGuBqBnSThqMPsGRjWVQadCrhoAT6CnSL3